
Have you recently run a Facebook campaign using a lookalike audience? Did it make you doubt whether or not they’re effective? No need to stress out, in this blog we’ll take a deep dive into the world of Facebook targeting.
Lookalike audiences in a nutshell
For years, organizations have used Facebook’s lookalike audiences to connect with a laser-targeted groups of people who “look like” their current supporters – meaning these people are more likely to take action.
Facebook lookalike audiences use data from your source email list to create an audience group that matches the characteristics of your ideal supporters – saying goodbye to wasted ad spend and hello to better results. It was the crème de la crème of targeting strategies!
But don’t get too excited, lookalike audiences may not be getting the same results they once did.
Big changes to Facebook’s targeting
Apple’s 2021 data privacy policies changed the game.
The big change: users are now required to opt-in to allow app tracking.
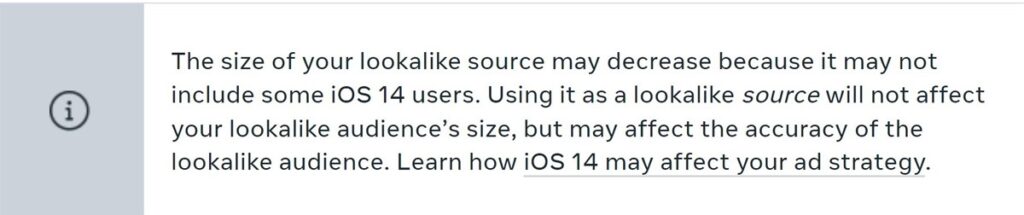
As of April 2022, only 25% of users had opted in. Now Facebook’s got a problem – it needs mobile traffic to stay on top of user activity outside of its platform. When tracking is a no-go, its algorithm is left in the dark.
Lookalike matching depends on algorithmic learning to match users, so with less data? Less matching. As a result, earlier this year we saw that lookalike audiences weren’t working like they used to.
Tricky, right?
This has caused a lot of organizations to wonder what to do next with targeting on Facebook.
Digging into some data and analytics
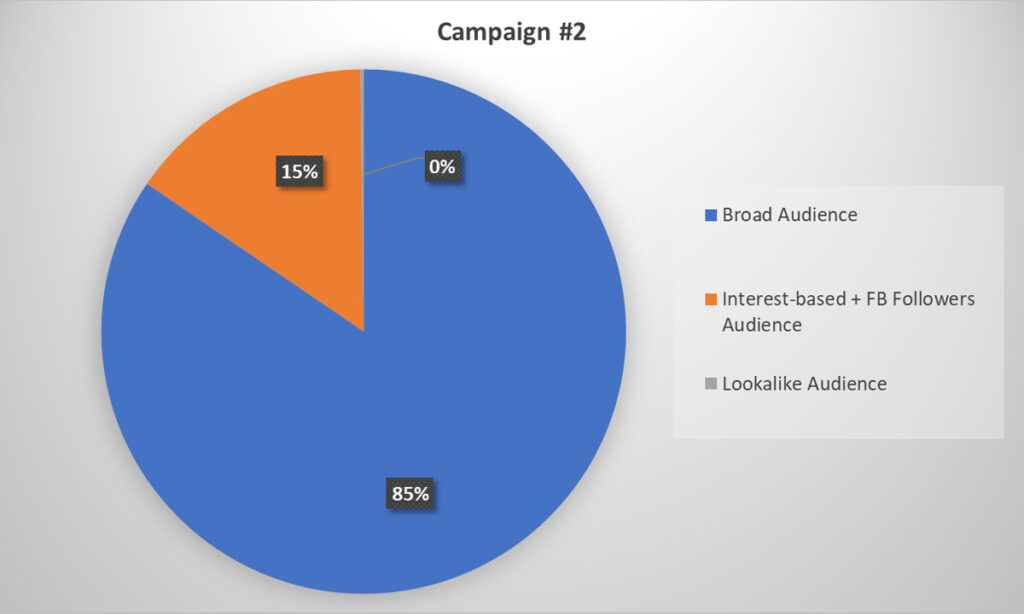
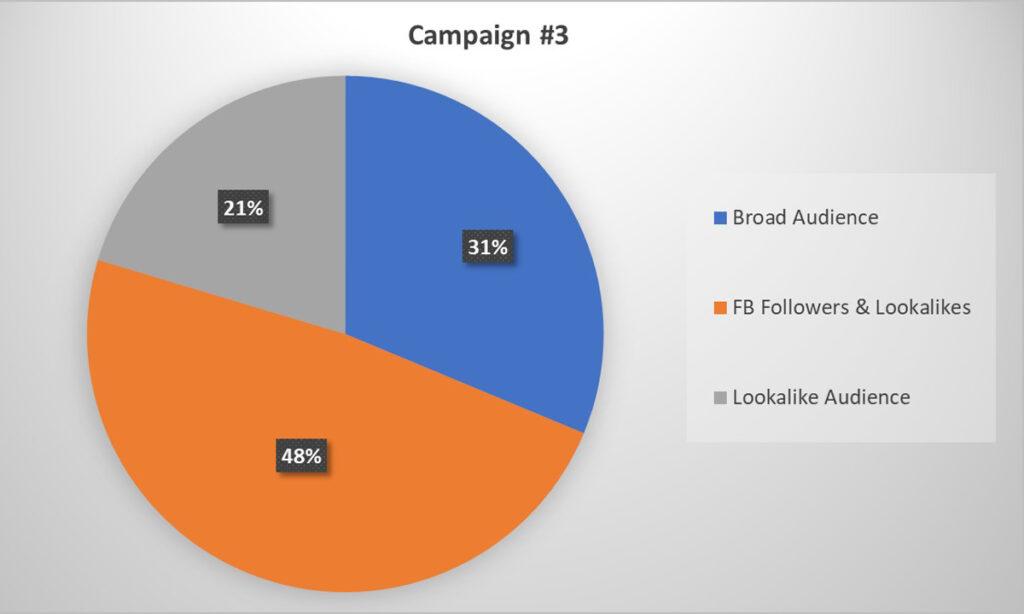
Since we manage a range of Facebook campaigns for Canadian charities here at Good Works, we spotted a new trend. Take a peek at our anonymous audience stats from three recent campaigns:
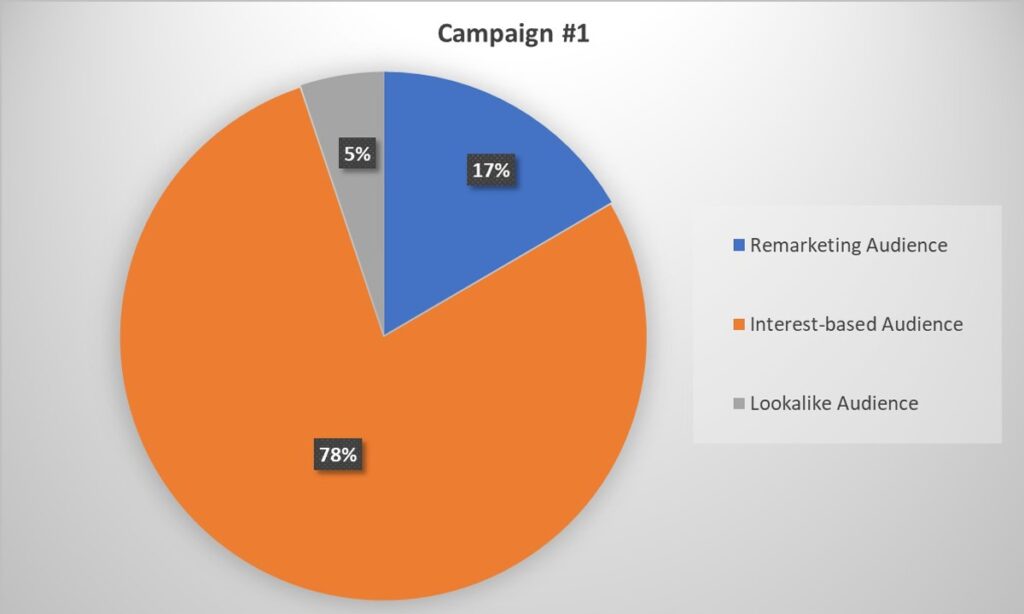
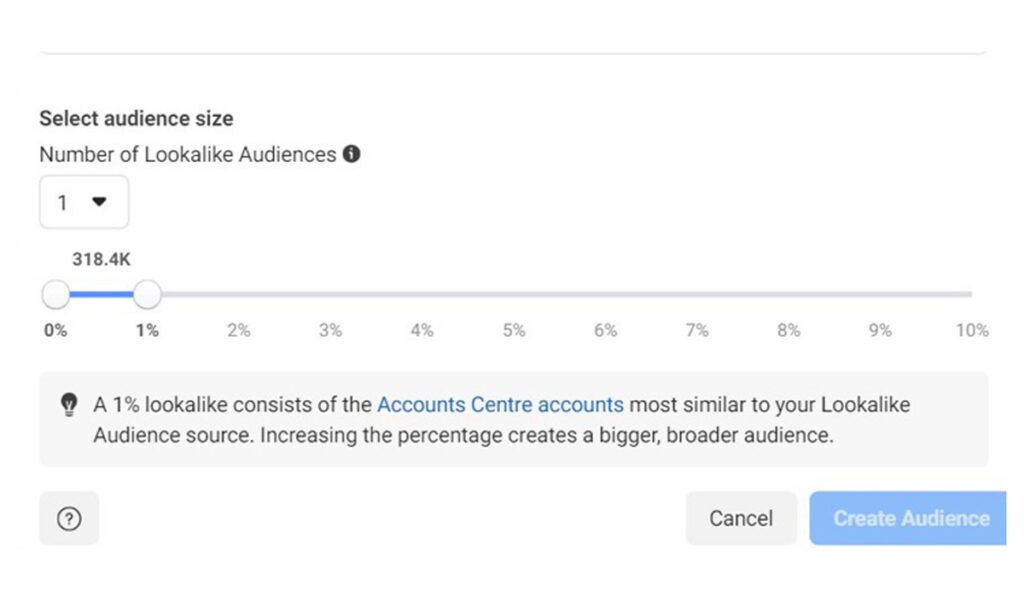
We used a 10% match for all three campaigns. When setting a lookalike audience size a 1% match gives you folks who are the most similar to your email list – it’s a small and exclusive club. On the flip side, if you go for a 10% match, you’ll get a larger pool, but it will include folks who bear a smaller resemblance to your source audience.
Now, the opt-outs I mentioned earlier mean that we must use a 10% match both to get the audience size we desire and to give the algorithm as much space to maneuver and optimize results as possible.
In each of these cases we had straightforward campaign goals: for campaigns 1 and 2, get leads, and for campaign 3, drive traffic to a donation form.
As shown in the charts the lookalike audiences generated the least favourable results in terms of leads and clicks.
What does this tell us about the value of lookalike audiences in 2023?
While there’s no one-size-fits-all answer to this, there is another part of the story to address.
Forget about the numbers, it’s all about quality! In the examples above lookalike audiences may have gotten a smaller piece of the pie, but lower volume doesn’t mean they’re not effective.
Since it’s common for digital campaigns not to break even immediately (you’re looking at anywhere from 9 to 24 months), our data collection and analysis is ongoing. We’re not yet able to fully assess the quality of the clicks and leads captured through the lookalike groups for the examples above.
Volume vs. Quality
Picture this: we have a campaign that generated a total of 500 leads. In terms of volume, audience A, the stellar performer, brings in 400 of those leads, while audience B trails behind by getting only 100 leads.
At first glance, you might think audience A is the obvious winner since it generated 80% of the total leads. But hold up! Don’t be fooled by these numbers alone. As I said, volume can be deceiving. It’s a good indicator of performance, but not the only factor to consider.
That’s because the true objective is to grow our giving file with top-notch users who convert into donors. Sure, capturing leads and clicks is important, but it’s not the endgame. What you really want is donors who will give again and again.
So, how can we determine the quality of a lead/click? Simple: by evaluating donor conversion rates and the cost per donation – these are your most important metrics!
Donor conversion rates show how many leads and clicks actually become donors (number of donors per number of leads or clicks), and the cost per donation shows which tactic gives the best return on investment (total cost divided by the number of generated donations).
Now, back to our example. Audience A may have generated 80% of the leads but only 20 of these leads converted into donors – with a donor conversion rate of 5% and a cost per donation of $156. On the other hand, while audience B accounted for only 20% of the leads, 40 of them converted into donors – with a donor conversion rate of 40% and a cost per donation of $70.
Voilà! Now you can see how the whole story just shifted and the real winner is revealed.
Test it yourself
The real measure of success lies in the quality of the generated clicks and leads, not just the volume.
Keep in mind that every organization is unique, so forget about uncritically hopping on the bandwagon of a trend and don’t dismiss lookalike audiences just yet! Put them to the test: gather your data, and evaluate the quality of your results. Only then can you decide whether they do or don’t work for you.
Stay tuned for my next blog where I’ll build on this foundation to share some tips & tricks you can use to make the most of your lookalike targeting.